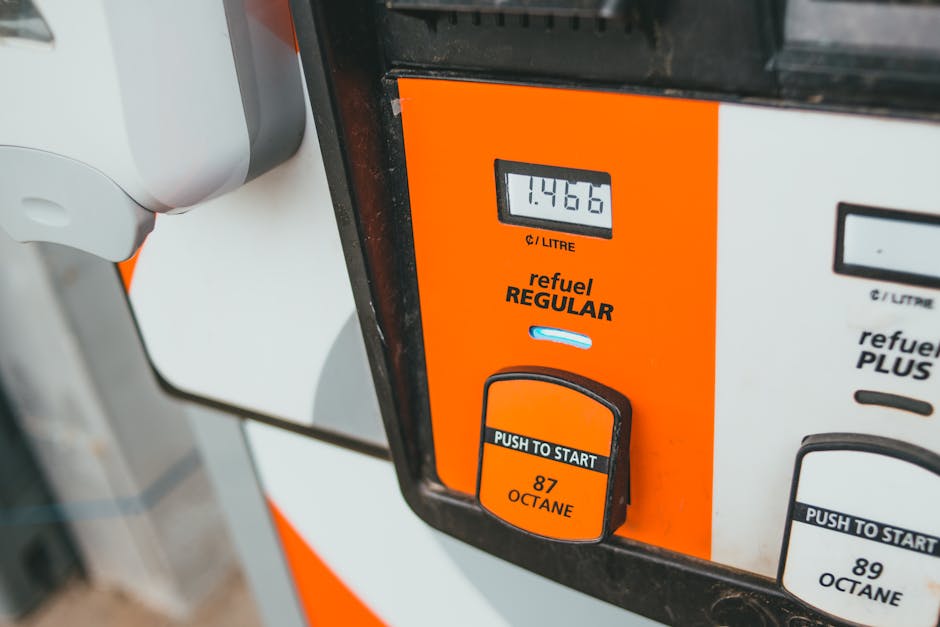
How Rising Fuel Prices Impact Your True Cost of Car Ownership
With national fuel prices at a four-year high, the real cost of owning a car is climbing faster than most drivers realize. Fuel expenses don't exist in isolation — they ripple through insurance calculations, resale values, and driving behavior in ways that quietly reshape your total annual ownership budget by hundreds or even thousands of dollars.
Understanding True Cost of Car Ownership Beyond the Sticker Price
Most people calculate car ownership costs by adding up their monthly loan payment and calling it a day. That approach misses the majority of what you actually spend. True cost of car ownership is a comprehensive figure that includes depreciation, fuel, maintenance, insurance, registration fees, financing costs, and opportunity cost on your down payment.
When fuel prices spike — as they have over the past several months — that single line item doesn't just hurt at the pump. It creates a cascading effect across multiple cost categories, some obvious and some surprisingly subtle.
According to the Bureau of Transportation Statistics (BTS), household transportation spending consistently represents the second-largest expense category for American families, trailing only housing. When fuel prices rise sharply, that ranking becomes even more entrenched.
Use our true cost of car ownership calculator to model how current fuel prices affect your specific vehicle and driving habits before making any major ownership decisions.
The Direct Impact: How Fuel Costs Stack Up in Your Annual Budget
Calculating Your Annual Fuel Spend
The math here is straightforward but often ignored until prices spike dramatically. Your annual fuel cost depends on three variables: miles driven per year, your vehicle's fuel economy (MPG), and the current price per gallon.
The formula looks like this:
Annual Fuel Cost = (Miles Driven ÷ MPG) × Price Per Gallon
Consider a driver logging the U.S. average of approximately 14,500 miles per year in a vehicle rated at 28 MPG. At $3.00 per gallon, that driver spends roughly $1,554 annually on fuel. At $4.20 per gallon — closer to current four-year high pricing in many markets — that same driver spends $2,175. That's a $621 annual increase from a single variable changing.
How Vehicle Class Changes the Equation
Fuel price increases don't hit all vehicle segments equally. Truck and SUV owners absorb the sharpest increases due to lower base fuel economy ratings. A full-size pickup averaging 18 MPG driven 14,500 miles annually costs approximately $3,383 per year in fuel at $4.20 per gallon, compared to $2,175 for the mid-size sedan example above. That's over $1,200 more per year in fuel alone.
This widening gap is critical context when comparing ownership costs across vehicle classes — something our vehicle comparison cost calculator can help you quantify side by side.
The Indirect Impact: How Fuel Prices Ripple Into Other Cost Categories
Depreciation and Resale Value Shifts
Fuel price spikes historically trigger measurable shifts in used car demand. When gas climbs above $4.00 per gallon for sustained periods, consumer demand pivots noticeably toward fuel-efficient vehicles and away from trucks, large SUVs, and performance vehicles. This demand shift directly affects residual values.
Owners of large trucks and performance SUVs during high fuel price periods often discover their vehicle's resale value has softened relative to pre-spike projections. Meanwhile, compact cars and hybrids may hold value or even appreciate modestly in high-demand secondary markets. Depreciation is typically the single largest component of true ownership cost — often representing 40-50% of the total five-year cost picture — so even modest resale value shifts have outsized budget consequences.
Insurance Premium Considerations
Fuel prices influence insurance costs through a less obvious mechanism: driving behavior. When fuel becomes expensive, some drivers reduce discretionary trips, lowering annual mileage. Fewer miles driven statistically reduces accident exposure, which can positively affect insurance premiums over time — particularly for drivers enrolled in usage-based or pay-per-mile insurance programs.
However, the opposite is also true for drivers who cannot reduce mileage due to commuting requirements. Those drivers absorb full fuel cost increases while receiving no corresponding insurance benefit.
Maintenance Costs and Deferred Service
Economic pressure from elevated fuel costs sometimes leads drivers to defer routine maintenance — oil changes, tire rotations, and fluid services — as a perceived short-term cost-saving measure. This is one of the costliest mistakes in vehicle ownership. A $75 oil change deferred for 5,000 extra miles can contribute to engine wear that accelerates depreciation and leads to repair bills that dwarf the original service cost.
Fuel price pressure on household budgets is real, but the maintenance trade-off typically works against the driver's financial interest over any 12-to-36-month window.
Strategies for Managing Fuel Costs Without Sacrificing Your Vehicle Budget
Optimize Driving Habits for Fuel Efficiency
Before making any major vehicle decisions, there are meaningful fuel savings available through behavioral changes alone. Research from the U.S. Department of Energy estimates that aggressive driving — hard acceleration and heavy braking — can reduce fuel economy by 15-30% on highways and up to 40% in stop-and-go traffic. Smoother acceleration and anticipatory braking are free fuel efficiency gains available to every driver immediately.
Maintaining proper tire inflation is another high-leverage habit. Underinflated tires increase rolling resistance and can reduce fuel economy by 0.2% to 3% depending on the severity of the pressure deficit, according to fuel economy data compiled by the Bureau of Transportation Statistics.
Recalculate Whether Your Current Vehicle Still Makes Financial Sense
Sustained high fuel prices are a legitimate trigger to reassess whether your current vehicle is the right financial tool for your current driving profile. This doesn't automatically mean you should sell and buy something else — transaction costs, depreciation at point of sale, and financing costs for a replacement vehicle often make staying put the better financial choice.
The analysis should account for:
- Your current vehicle's remaining depreciation curve
- The fuel savings a replacement would actually generate annually
- Financing costs on a new purchase
- Opportunity cost of capital used for a down payment
Running that full calculation is exactly what ownership cost modeling tools are built for — don't make a five-figure decision based on a back-of-napkin fuel savings estimate alone.
Consider Hybrid and EV Economics at Current Fuel Prices
At $4.00+ per gallon, the payback period for hybrid and plug-in hybrid vehicles shortens considerably compared to assumptions made when gas hovered near $3.00. A hybrid commanding a $4,000 price premium over an equivalent non-hybrid model at 28 MPG versus 48 MPG — driven 14,500 miles annually at $4.20 per gallon — generates approximately $877 in annual fuel savings. That moves the break-even point inside five years, not accounting for any applicable tax credits that may further accelerate the math.
The economics shift significantly at different fuel price levels, which is why static comparisons miss the point. The right analysis uses your actual fuel price environment, not a national average from two years ago.
How to Build a More Accurate Car Ownership Budget
The Seven Cost Categories to Include
A defensible total cost of ownership model includes all seven of these categories:
- Depreciation — typically calculated as purchase price minus projected resale value over your ownership period
- Fuel — based on your actual annual mileage and current fuel prices, not EPA estimates alone
- Insurance — get current quotes rather than using prior-year figures
- Maintenance and repairs — manufacturer-scheduled service plus statistically expected repairs by vehicle age and mileage
- Financing costs — total interest paid over the loan term, not just monthly payment
- Registration and fees — varies significantly by state
- Opportunity cost — the return your down payment capital could have generated in an alternative investment
Most drivers who model these seven categories for the first time are surprised to find that fuel — even at four-year highs — typically represents 15-25% of total ownership cost rather than the majority they assumed. Depreciation and financing costs usually dominate the picture.
Frequently Asked Questions
How much do fuel prices need to rise before it makes sense to switch vehicles?
There's no universal threshold because the answer depends on your current vehicle's fuel economy, remaining depreciation, financing situation, and the specific replacement you're considering. The break-even analysis needs to compare your incremental fuel savings against all transaction costs and new financing costs. In most cases, fuel prices need to remain elevated for multiple years — not months — before a vehicle switch generates net savings over staying with a current paid-off or nearly paid-off vehicle.
Does driving fewer miles during high fuel price periods affect my total ownership cost calculation?
Yes, significantly. Reducing annual mileage lowers your direct fuel spend, can reduce wear-and-tear maintenance frequency, may improve your resale value timeline by keeping odometer readings lower, and can reduce insurance premiums in usage-based programs. However, if reduced driving affects your income — for gig workers, outside sales roles, or others — the financial equation becomes more complex and needs to account for productivity costs alongside transportation savings.
Are fuel costs tax deductible for personal vehicle owners?
For purely personal use, fuel costs are not deductible. However, if you use your vehicle for self-employment, business travel (not commuting), medical transportation, or qualifying charitable purposes, you may be able to deduct either actual expenses including fuel or use the IRS standard mileage rate, which is updated periodically and already incorporates fuel cost factors. Consult IRS Publication 463 and a qualified tax professional for guidance specific to your situation.
What fuel economy should I actually use in my ownership cost calculations?
Use your real-world observed MPG rather than the EPA window sticker estimate. Most drivers achieve 10-20% below EPA combined ratings in everyday driving due to climate, traffic patterns, driving style, and load. If you haven't tracked your actual fuel economy, log three to five fill-up cycles using the trip odometer divided by gallons dispensed. That observed figure will produce a far more accurate ownership cost projection than the manufacturer's published estimate.